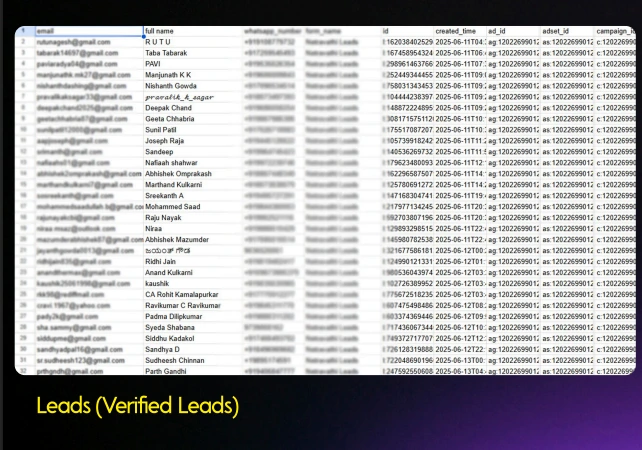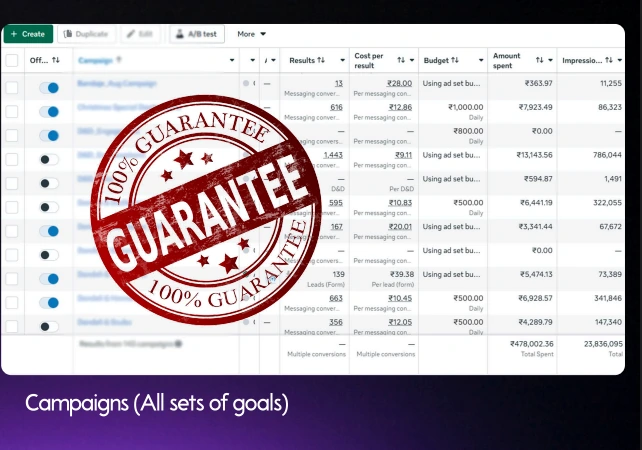
We've worked across a number of industries and achieved incredible results with incredible people and brands — no cherry-picked numbers, this is the actual ads manager.
Live campaign data from an active client account — reach, impressions and leads, tracked month over month.
*July reflects partial-month data (1–14 Jul 2026).
| Month | Reach | Impressions |
|---|---|---|
| Jan 2026 | 165,820 | 338,870 |
| Feb 2026 | 443,583 | 642,928 |
| Mar 2026 | 683,677 | 1,121,189 |
| Apr 2026 | 207,227 | 350,849 |
| May 2026 | 1,105,591 | 1,972,641 |
| Jun 2026 | 580,785 | 1,184,424 |
| Jul 2026 (1–14) | 515,547 | 1,110,546 |
Figures pulled directly from live Meta Ads Manager reporting for an active client account. Leads figure reflects verified, form-confirmed leads delivered across the same period.
Concept explainers, exam-prep posters and course-launch campaigns for accountancy coaching.
Match-day screenings, live-band nights, cocktail features and food shoots for a premium bar & kitchen.
Trek posters, ride announcements and seasonal campaigns that actually filled up buses.
A look at the actual posts, posters and product content that went live for these clients.
Explainer posters, myth-busting, and bill-cutting campaigns for rooftop solar.
Teaser drops, product reveals and lifestyle shoots for a card game brand built to bring families back to the table.
No brand-size vanity metrics here — just what the content itself has actually earned.
Figures reflect organic view counts on published reels across our content portfolio.
Hear from clients we've built campaigns and content for.